[转载]基于PostGIS动态矢量切片实践
原文出处:https://zhuanlan.zhihu.com/p/349849542
一、前言
在PG支持ST_AsMVT函数之前,如果要从PostGIS中生成矢量切片,需要借助地图服务软件,如:MapServer,GeoServer或Mapnik。从PostGIS2.4.0及以上版本后,可以使用ST_AsMVT聚合函数将基于MapBox VectorTile坐标空间的几何图形转换为MapBox VectorTile二进制矢量切片。
二、安装PostGIS
1、软件下载
文章中使用的软件版本
- postgresql:10.15
- postgis:3.1.1
链接:https://pan.baidu.com/s/1FMNPPwRoMRQAm6Ro0-WNkg 提取码:4eox
2、软件安装
安装postgresql后,不要选择继续安装postgis扩展,在线下载安装会很慢,可能会失败。直接安装下载后的postgis包即可。
三、创建空间数据库
创建空间库的时候需要选择定义模板,不然创建的并不是空间数据库。如果忘记选择模板,可以使用脚本命令实现。
CREATE EXTENSION postgis;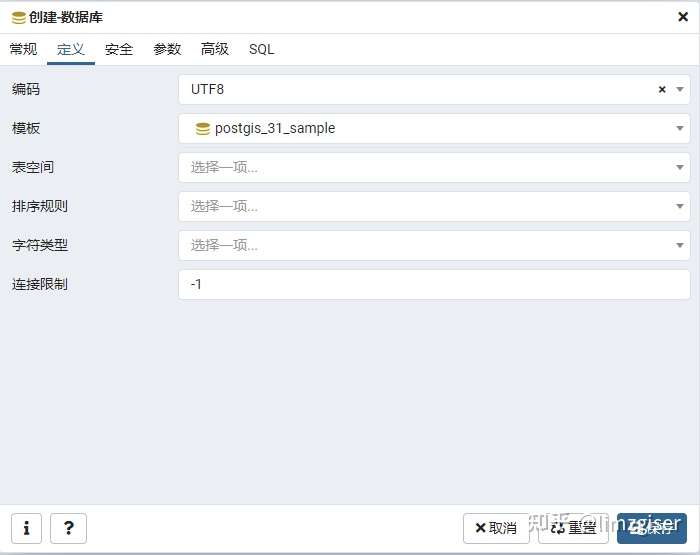
四、导入数据
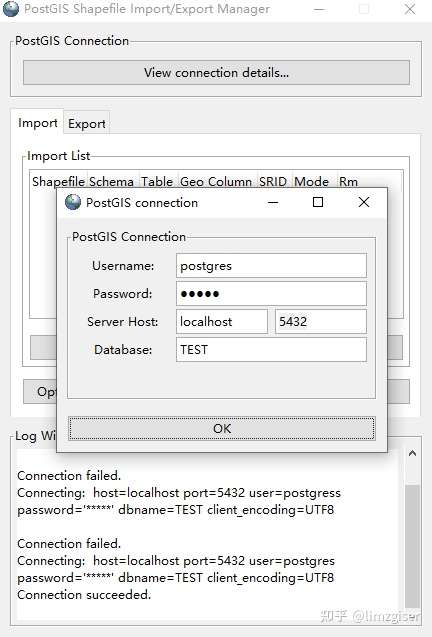
安装PostGIS后会提供一个数据导入工具,可以将shapefile数据导入到指定数据库中。
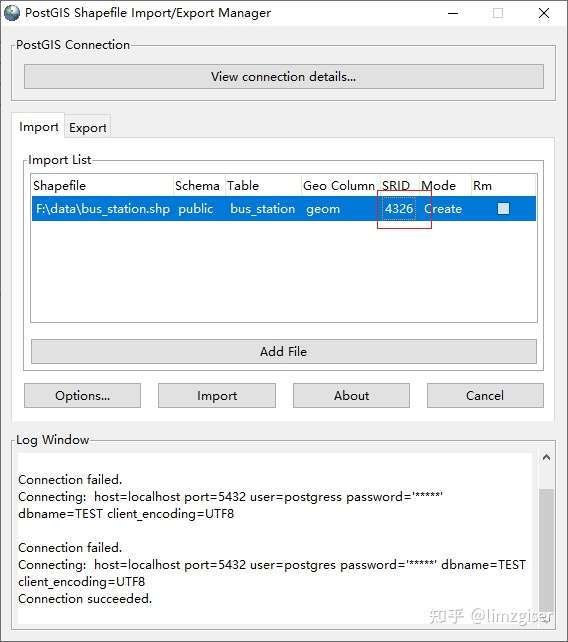
选择PostGIS Shapefile Import工具 ,输入用户密码,数据库地址,连接数据库,导入数据。
注意:文件名和文件路径不要是中文,导入可能会失败。
注意:不要忘记输入SRID编码,测试数据是wgs84坐标系,这里是4326。
五、后端实现
仓库地址:dirt-simple-postgis-http-api,克隆后安装依赖并运行。
修改config目录中的index.json,例如我的配置。
修改前:
"db": "postgres://user:password@server/database",
修改后:
"db": "postgres://postgres:admin@127.0.0.1:5432/TEST",
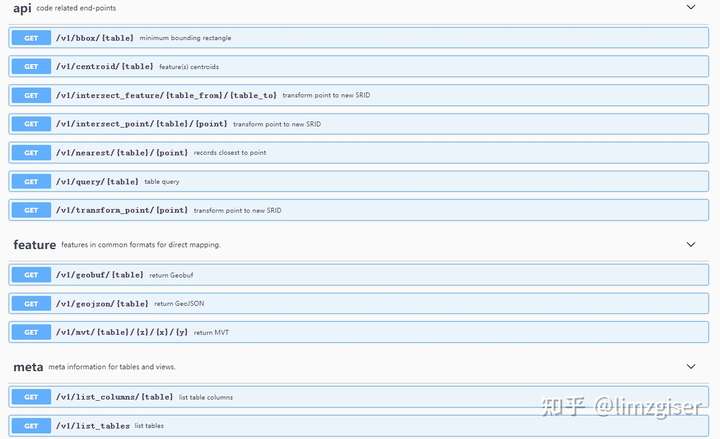
后端代码运行后,访问localhost:3000查看API文档
六、前端实现
数据库中导入了两个shapefile图层。一个建筑地块,含高度字段(height);一个公交站点,建筑表使用动态矢量切片的方式访问;公交站点使用geojson api访问。前端使用mapboxgl渲染。
注意:矢量切片数据源的路径,参考api。
<!DOCTYPE html>
<html>
  <head>
    <meta charset="utf-8" />
    <title>Display a map</title>
    <meta
      name="viewport"
      content="initial-scale=1,maximum-scale=1,user-scalable=no"
    />
    <script src="https://api.mapbox.com/mapbox-gl-js/v1.11.0/mapbox-gl.js"></script>
    <link
      href="https://api.mapbox.com/mapbox-gl-js/v1.11.0/mapbox-gl.css"
      rel="stylesheet"
    />
    <style>
      body {
        margin: 0;
        padding: 0;
      }
      #map {
        position: absolute;
        top: 0;
        bottom: 0;
        width: 100%;
      }
    </style>
  </head>
  <body>
    <div id="map"></div>
    <script>
      mapboxgl.accessToken =
        "pk.eyJ1IjoibGltemdpc2VyIiwiYSI6ImNqZXFvemJlcjB1bWYyd2x0eGxjeGdvcXIifQ.gSsj63R-2VZV7L7mpSw0Uw";
      var map = new mapboxgl.Map({
        container: "map", // container id
        style: "mapbox://styles/mapbox/streets-v11",
        center: [121, 31],
        zoom: 9,
      });
      map.on("load", function () {
        map.addLayer({
                'id': 'buildinds',
                            source: {
                type: "vector",
                tiles: ["http://localhost:3000/v1/mvt/sz_build/{z}/{x}/{y}?columns=height"],
              },
              "source-layer": "sz_build",
                'type': 'fill-extrusion',
                'paint': {
                    'fill-extrusion-color': [
                        'interpolate',
                        ['linear'],
                        ['to-number',['get', 'height']] ,
                        0, 'rgb(255,255,191)',
                        75, 'rgb(253,174,97)',
                        150, "rgb(215,25,28)",
                    ],
                    'fill-extrusion-height': ['to-number',['get', 'height']] ,
                    'fill-extrusion-opacity': 1
                }
            });
            map.addLayer({
              id: "dirt-geojson",
              type: "circle",
              source: {
                type: "geojson",
                data: "http://localhost:3000/v1/geojson/bussta",
              },
              paint: {
                "circle-radius": 2,
                "circle-color": "blue",
              },
            });
      });
    </script>
  </body>
</html>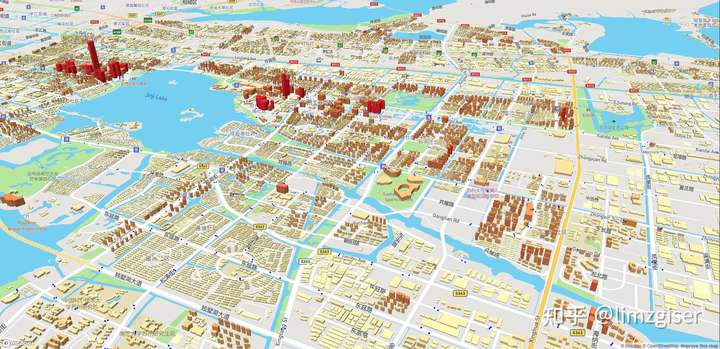
七、参考
Serving Dynamic Vector Tiles from PostGISinfo.crunchydata.com dirt-simple-postgis-http-apigithub.com