[转]GeoServer官方教程:矢量切片
原文: https://blog.csdn.net/qq_35732147/article/details/89354557
目录
一、为什么使用矢量切片(vector tiles)?
矢量切片的优点是:
- 数据在客户端渲染(例如,OpenLayers),而不是在服务端。这允许不同的地图应用程序使用不同的样式去渲染一个地图,而不需要事先在服务端(比如GeoServer)进行预先的样式配置。
- 矢量切片的大小通常比图片小,这可以使得数据传输得更快以及使用更低的带宽。
- GeoServer内嵌的GeoWebCache可以有效地存储矢量切片数据。由于样式由客户端配置,而不是在服务器配置,因此GeoWebCache只需要存储矢量切片,而不需要存储样式配置。
- 由于在客户端上可以获取到矢量数据,所以不需要相应地增加带宽,就可以绘制分辨率很高的地图。
- 客户端可以本地访问实际的要素信息(属性信息和几何信息),所以可以进行非常复杂和精细的要素渲染。
另一方面,矢量切片的主要缺点是需要对地理数据进行预处理,以便客户端能够完成所需的绘图(类似于图像瓦片地图的预处理数据)。考虑到这一点,矢量切片只能用于渲染。(怪叔叔:虽然是矢量格式,但是它们不可编辑,矢量切片是为了读取和渲染优化的格式,如果想在客户端编辑要素,最适合的是使用OGC的WFS)。
二、矢量切片格式
GeoServer可以生成三种格式的矢量切片:GeoJSON,TopoJSON,MapBox Vector(MVT)。这些矢量切片格式也得到OpenLayers和其他客户端地图引擎的支持。
注意:当使用矢量切片时,请确保使用最新的客户端地图引擎,老版的地图引擎不支持矢量切片并会产生渲染错误。建议使用最新版的OpenLayers(目前最新版位v5.3.0)。
MVT是生产环境中首选的矢量切片格式。
| 格式 | MIME | 描述 |
|---|---|---|
| MapBox Vector(MVT) | application/x-protobuf;type=mapbox-vector | 推荐的格式。这是一种高效的二进制格式,几乎所有的矢量切片应用程序都支持这种格式。 |
| GeoJSON | application/json;type=geojson | 这是一种人类可读的JSON格式。虽然许多GIS应用程序支持GeoJSON数据集,但很少有矢量切片应用程序支持这种格式的切片。OpenLayers支持这种格式的矢量切片。 |
| TopoJSON | application/json;type=topojson | 这是一种非常复杂,但有一点人类可读性的JSON格式,对多边形覆盖很好,但是很少有矢量切片应用程序支持它。OpenLayers支持这种格式的矢量切片。 |
三、安装GeoServer的矢量切片插件
GeoServer的矢量切片插件是官方的插件,可以在GeoServer download页面中下载。
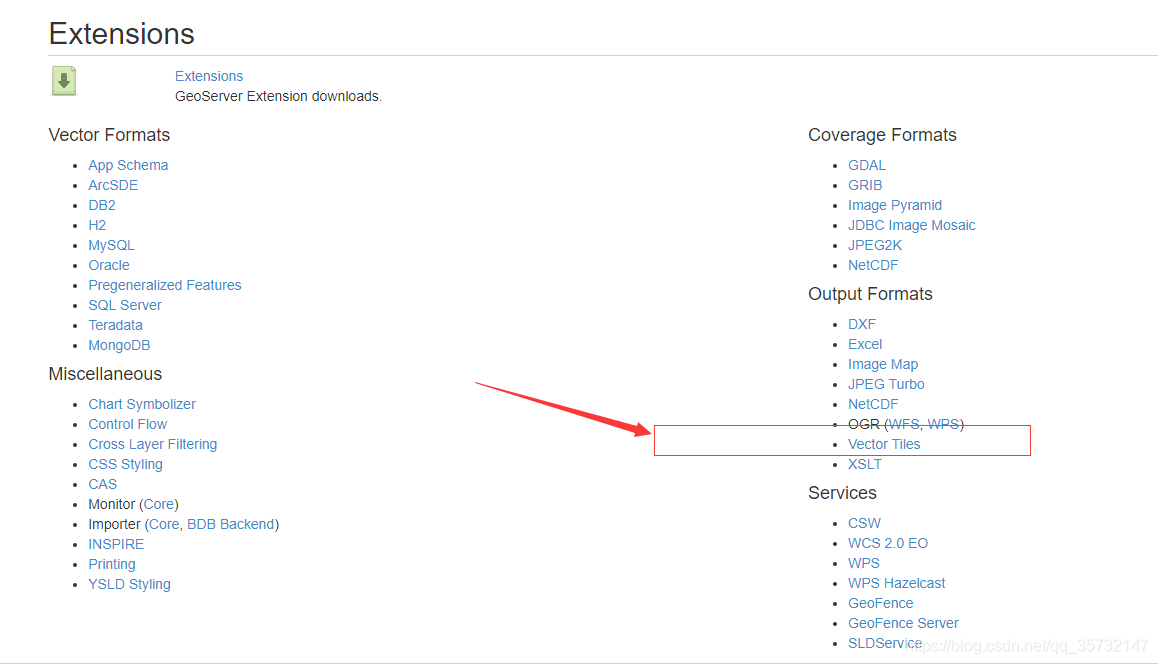
1.下载和你的GeoServer版本对应的矢量切片插件。
注意:一定要版本对应。
2. 将下载的内容解压(jar包)并复制到GeoServer的WEB-INF/lib文件夹下。
3. 重新启动GeoServer。
接下来,验证矢量切片扩展是否已安装成功:
1. 打开GeoServer的Web管理界面。
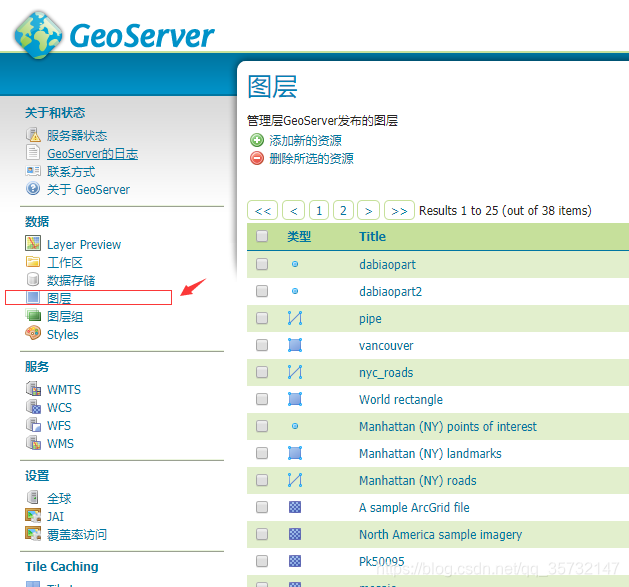
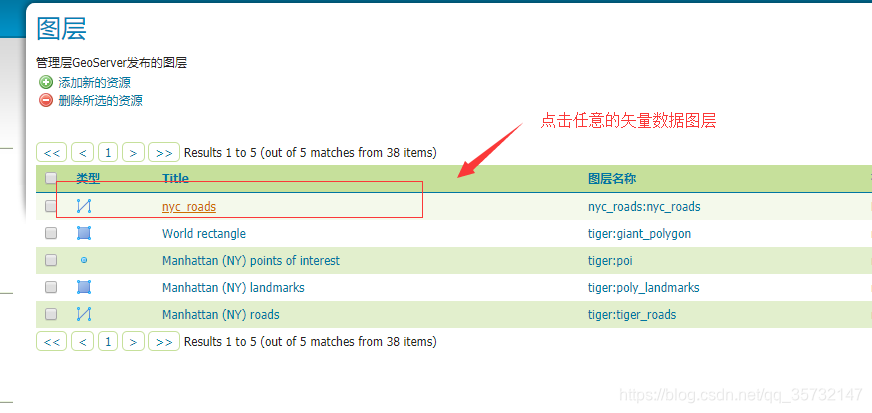
2. 单击”图层“并随意选择一个矢量图层。
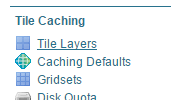
3. 点击”TileCaching“面板
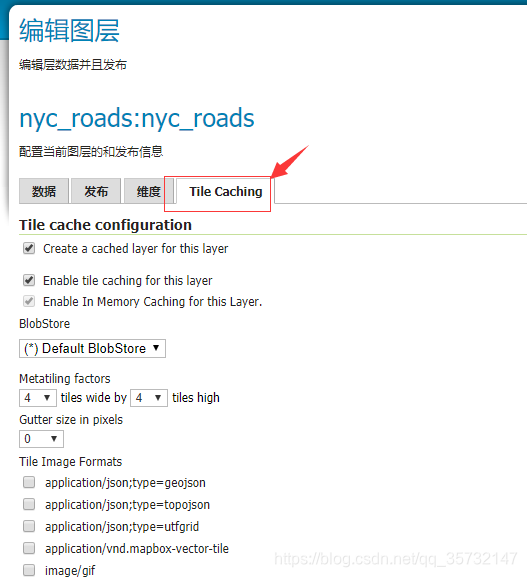
4. 滚动页面到”Tile Image Formats“部分,除了标准的GIF/PNG/JPEG格式之外,你还应该看到以下内容:
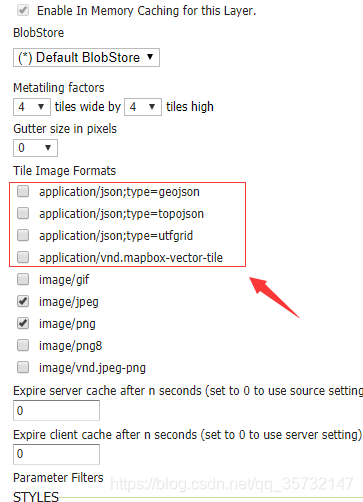
如果你看到了这些选项,那么就表示扩展已经安装成功了。
四、发布GeoWebCache中的矢量切片
我们将通过GeoWebCache发布矢量切片,并在自定义的OpenLayers中发布发布该图层。
在本教程中,我们将使用opengeo:countries来展示这些功能,只要稍加处理,任何图层都可以具有这样的功能。
注:下载Admin 0 – Countries shapefile并将该图层发布为opengeo:countries。
1. 在GeoServer管理界面,单击”Tile Layers“。
2. 在图层列表中单击”opengeo:countires”。
3. 默认情况下,切片格式是image/jpeg和image/png。选中下列矢量切片格式:
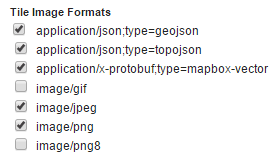
4. 点击”保存“。
我们的这一个图层已经准备好了。
五、创建OpenLayers应用程序
1. 在GeoServer数据目录中创建一个www/vectortiles文件夹。
2. 下载最新版本的OpenLayers。
3. 将以下文件从下载的压缩包里解压到步骤1创建的目录中:
- ol.js
- ol-debug.js
- ol.css
4. 在文本编辑器中,创建具有以下内容的新文件:
- <!DOCTYPE html -->
- <html>
- <head>
- <title>Vector tiles</title>
- <script src="ol.js"></script>
- <link rel="stylesheet" href="ol.css">
- <style>
- html, body {
- font-family: sans-serif;
- width: 100%;
- }
- .map {
- height: 500px;
- width: 100%;
- }
- </style>
- </head>
- <body>
- <h3>Mapbox Protobuf - vector tiles</h3>
- <div id="map" class="map"></div>
- <script>
-
- var style_simple = new ol.style.Style({
- fill: new ol.style.Fill({
- color: '#ADD8E6'
- }),
- stroke: new ol.style.Stroke({
- color: '#880000',
- width: 1
- })
- });
-
- function simpleStyle(feature) {
- return style_simple;
- }
-
- var layer = 'opengeo:countries';
- var projection_epsg_no = '900913';
- var map = new ol.Map({
- target: 'map',
- view: new ol.View({
- center: [0, 0],
- zoom: 2
- }),
- layers: [new ol.layer.VectorTile({
- style:simpleStyle,
- source: new ol.source.VectorTile({
- tilePixelRatio: 1, // oversampling when > 1
- tileGrid: ol.tilegrid.createXYZ({maxZoom: 19}),
- format: new ol.format.MVT(),
- url: '/geoserver/gwc/service/tms/1.0.0/' + layer +
- '@EPSG%3A'+projection_epsg_no+'@pbf/{z}/{x}/{-y}.pbf'
- })
- })]
- });
- </script>
- </body>
- </html>
5. 将此文件名改为index.html保存在上面创建的文件夹中。
6. 导航到 http//localhost:8080/geoserver/www/vectortiles/index.html 并验证输出是否显示没有任何错误。
注意:如果你的GeoServer服务器部署在 http://localhost:8080/geoserver/ 以外的服务器上,那么请自行调整上面的URL。
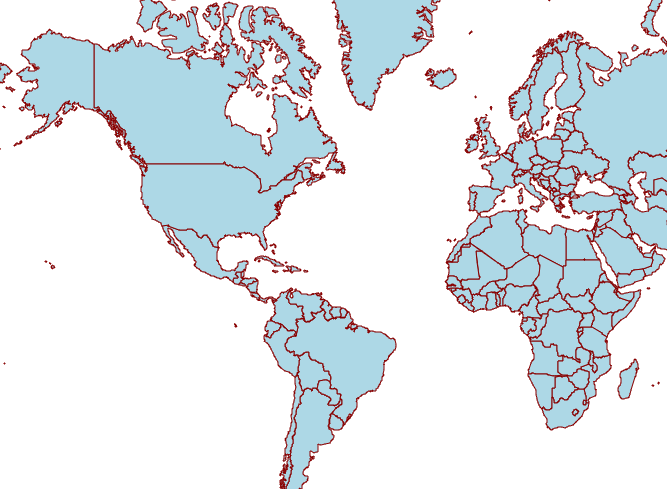
这些矢量切片是由OpenLayers客户端渲染的。
六、为矢量切片修改样式
由于这些矢量切片是在客户端中渲染的,所以我们只需要更改客户端应用程序中相关的样式命令就能修改矢量切片的样式,而不需要对GeoServer(服务器端)进行任何更改,也不必在GeoServer中重新生成矢量切片。
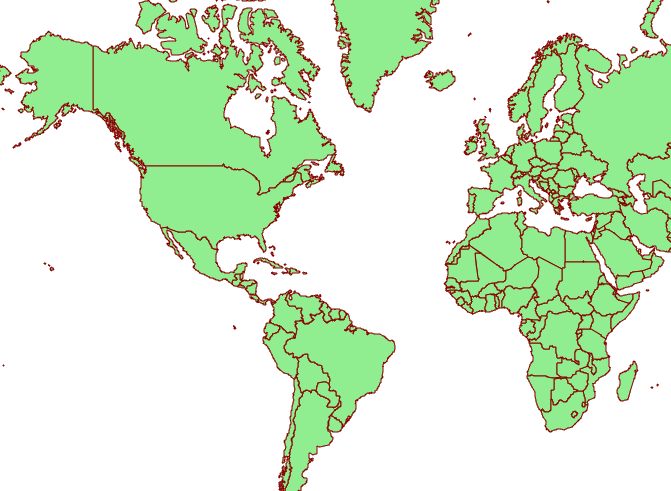
1. 将填充颜色改为light green:
- var style_simple = new ol.style.Style({
- fill: new ol.style.Fill({
- color: 'lightgreen'
- }),
- stroke: new ol.style.Stroke({
- color: '#880000',
- width: 1
- })
- }) ;
2. 保存文件并刷新浏览器。
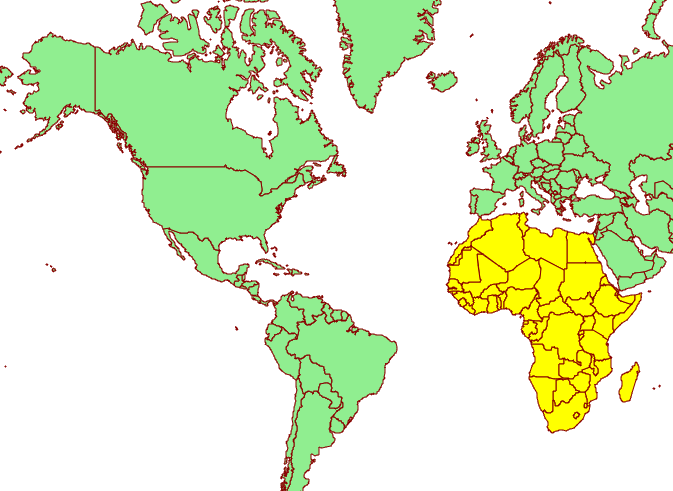
3. 我们也可以构建基于属性的样式。这个数据集包含了一个属性(region_un),该属性包含国家所在的区域。让我们通过在现有样式下面添加另一个样式定义来高亮渲染非洲国家。
- var style_highlighted = new ol.style.Style({
- fill: new ol.style.Fill({
- color: 'yellow'
- }),
- stroke: new ol.style.Stroke({
- color: '#880000',
- width: 1
- })
- });
4. 替换现有的样式函数:
- function simpleStyle(feature) {
- return style_simple;
- }
替换为下面这个:
- function simpleStyle(feature) {
- if (feature.get("region_un") == "Africa") {
- return style_highlighted;
- }
- return style_simple;
- }
5. 保存文件并刷新浏览器。
6. openlayers 调用geoserver发布的矢量切片 (TMS) 地址可以在geoserver首页查看
import MVT from 'ol/format/MVT'
import { VectorTile as VectorTileLayer } from 'ol/layer.js'
import { VectorTile as VectorTileSource } from 'ol/source.js'

let layer = new VectorTileLayer({
      source: new VectorTileSource({
        format: new MVT(),
        url: 'http://192.168.0.209:8097/geoserver/gwc/service/tms/1.0.0/ilng_2%3Aa_pipeline@EPSG%3A900913@pbf/{z}/{x}/{-y}.pbf'
      }),

    })
    this.map.addLayer(layer)